The growth curve of bacteria is a standard curve that indicates four distinct phases like log, lag, stationary, and death, showing a sigmoid growth pattern. The Growth of bacteria and other organisms is characterized by increased cell number, cell size and cell mass. Factors like temperature, pH, oxygen requirement, nutrients availability, moisture content etc., greatly influence bacterial growth. Bacteria are prokaryotic or unicellular organisms, which most frequently reproduce through binary fission.
To study the growth curve of bacteria, there are some important measures that we must keep in mind:
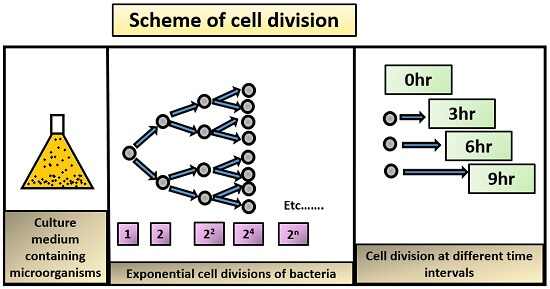
- There should be a suitable culture medium for the growth of the microorganisms. After utilizing the nutrients of the culture medium, cell division occurs in a logarithmic pattern, i.e. the growth of bacteria is always expressed in the logarithmic unit, not arithmetic.
- In logarithmic growth, we will obtain a non-linear graph, and we could see the exponential increase in the number, i.e. 1, 2, 22 and so on. Oppositely, arithmetic growth provides a linear and uniform growth pattern.
- We can only see the distinct growth phases after the incubation of bacteria at different time intervals.
In this context, we will discuss the growth of bacteria and the mathematics behind the bacterial generation, along with the different growth phases of bacteria.
Content: Growth Curve of Bacteria
- Growth of Bacteria by Binary Fission
- Mathematical Expression of Bacterial Growth
- Video
- Phases of Growth Curve
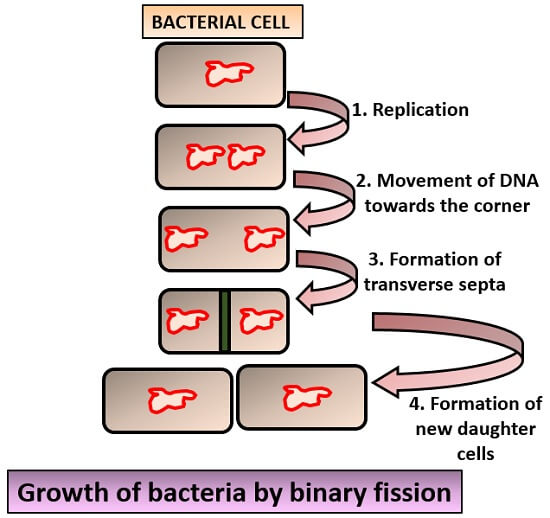
Growth of Bacteria by Binary Fission
Binary fission is a type of vegetative reproduction, which predominantly occurs in bacteria and involves the following steps:
- The bacterial cells contain a single copy of DNA.
- Then, the process of replication occurs by which the bacterial cell will form two copies of DNA.
- After the replication, each DNA moves towards the corner of the bacterial cell.
- Then, the cell wall protrudes into the cytoplasm and form a transverse septum.
- This transverse septum will divide or separates the cell into two identical daughter cells.
Mathematical Expression of Bacterial Growth
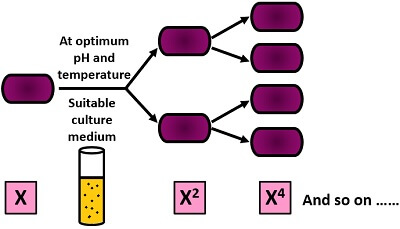
The growth pattern of bacteria is in a geometric fashion, i.e. a bacterial cell first divides into two, then four, then six, and so on ( x, x2,x4,x6……xn). Here, n indicates the number of generations.
To mathematically express the growth of bacteria, there is a relationship that exists between the initial number of cells (in the log phase) and the final number of cells (after the log phase) in the cell culture, which can be expressed as:
N=N0 X 2n …………… (Equation 1)
- The final number of cells: N
- The initial number of cells: N0
- Number of generations: n
Taking log at both the sides in equation 1
Log10 N= Log10 N0 + n Log10 2
n= Log10 N- Log10 N0/ 2
n= Log10 N- Log10 N0/ 0.301
n=3.3 (Log10 N- Log10 N0)
Important terms to remember:
Generation time: It represents the total time that is required by the bacteria to double its population. ‘g’ is an acronym for the term generation time. Mathematically, it is expressed as:
g =t/n
- t: Time is taken by the individual bacterium for the cell division into two.
- n: Number of generations.
Growth rate: It defines the number of generations of bacteria per hour. ‘R’ is an acronym for the term growth rate. Mathematically, it is expressed as:
R=n/t
- n: Number of generations.
- t: Cell division of bacteria per hour.
Video
Phases of the Growth Curve
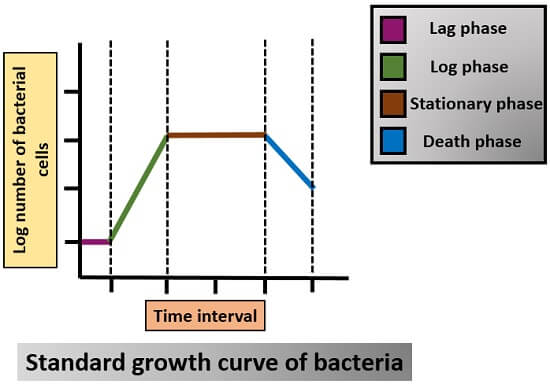
The different phases in the growth cycle of bacteria at the given time interval can be defined as the growth curve of bacteria. To obtain a standard growth curve of bacteria, we need to follow the given protocol:
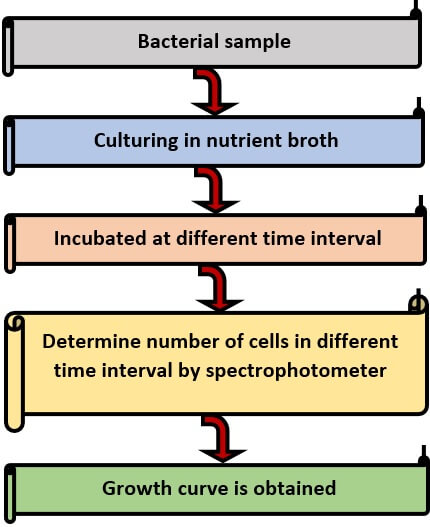
- First, take the fresh bacterial sample.
- Then, inoculate it into the fresh culture medium (nutrient broth) that contains all the nutrients for microbial growth.
- After that, incubate the bacteria at different time intervals and determine the bacterial cell count at that given time interval using a spectrophotometer.
- At last, note down the readings to plot a standard graph between the log number of bacteria and the time interval.
There are distinct four phases in the growth curve of bacteria.
- Lag phase
- Log phase
- Stationary phase
- Death phase
Lag Phase
This phase is the “Adaptation or Adjustment phase”, in which the microorganisms adapt themselves to the new environment of the growth medium. Microorganisms retain in this phase for a short period of time (1hr- several days). This phase is characterized by the no increase in cell number. The microorganisms only grow in size. In the lag phase, microorganisms release some metabolites:
- For adaptation.
- To restore the spent material.
Log Phase
This phase is also called as “Exponential or Logarithmic phase”. This phase shows an intense metabolic activity of microorganisms due to the production of primary metabolites. These metabolites enhance the growth rate, i.e. an increase in cell number as well as cell size. It is a period of rapid growth. In this phase, microorganisms are resistant to adverse conditions:
- Antibiotic
- Radiation
Here, the number of cells produced > the number of cells dying.
Stationary Phase
It is also called the “Stagnant phase”. During this phase, population size is in a state of equilibrium. Cell division begins to slow down. Overall, there is no increase in cell number and cell mass. Factors that slow down the process of cell division can be due to the following:
- Limited nutrient availability
- Accumulation of toxic product
- An acidic PH of media
- Low oxygen availability
Here, the number of cells produced = the number of cells dying.
Death Phase
This phase also refers to the “Decline phase”, which is the last stage of the growth curve. In this, the population size decreases at the logarithmic rate. The death phase is characterized by the loosing of the cell division ability of microorganisms.
Here, the number of cells produced < the number of cells dying.